New Zealand Doctor tried to get a handle on how much patients contribute to general practice funding from their own pockets (and/or their insurance companies).
A rule of thumb used to be that general practice income was roughly a 50/50 split between government funding and patient fees.
In 2015, the Peter Moodie-led Report of the Primary Care Working Group on General Practice Sustainability stated that patient copayments “still constitute half, or more than half” of many general practice’s revenue.
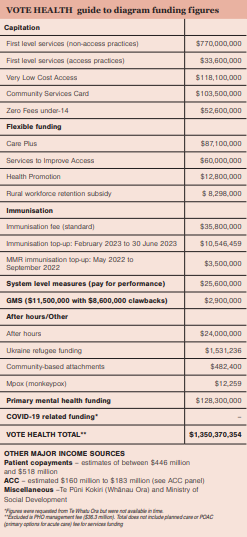
However, on latest estimates, income from patients’ fees now looks more like a third of total core revenue, with patients spending in the order of $500 million compared to the $1 billion-plus in government capitation and fee subsidy funding.
Exact figures on fees aren’t readily available. The capitation report by Sapere – A Future Capitation Funding Approach – used household spending statistics and estimated that patients spent $446 million in general practice copayments in 2021/22.
In a Te Whatu Ora 2022 funding briefing, it is calculated that copayment revenue that year was $502 million. This compared with a 2017/18 peak of $506 million followed by a dip in fees revenue to between $472 million and $488 million for the intervening years.
Te Whatu Ora attributes the dip to the likely impact of increasing Community Services Card subsidies and introducing Zero Fees for under-14s. The agency has predicted fees revenue will reach about $518 million in 2022/23. The PHO Services Agreement limits the extent that practices can raise their prices to patients (any excess can be shot down by fees reviewers).
Practices’ individual fee revenue varies widely. A quick search of general practice websites shows enrolled adults can pay zero or up to $19.50 for a consultation at a Very Low Cost Access practice and up to $70 to $86 at some Wellington and Auckland practices.
Green Cross Health general manager medical Wayne Woolrich says copayments range from 20 to 35 per cent of its practices’ income, with fee income trending downwards in recent years due to COVID-19.
South Link Health chief executive Karl Andrews says the model for its practices is based on capitation providing roughly 60 per cent of practice funding, with the other 40 per cent mostly a mix of patient fees and flexible funding streams that vary from region to region.
Findex business advisory manager Leicester Gouwland says at the higher-charging, non-Access end of the general practice sector, 50 per cent or more of income likely still comes from copayments.
The ratio of sector income from patients may be trending down, but that forecast $518 million is still the equivalent of 2.15 per cent of Vote Health’s $24 billion allocation.
Patients will remain an essential funding source unless, or until, general practice gains a bigger share of that much sought-after bucket of health dollars.


![[Image: Drew Beamer on Unsplash]](/sites/default/files/styles/cropped_image_4_3/public/2023-02/drew-beamer-Se7vVKzYxTI-unsplash.jpg?itok=C7-gZOj_)


![Barbara Fountain, editor of New Zealand Doctor Rata Aotearoa, and Paul Hutchison, GP and senior medical clinician at Tāmaki Health [Image: Simon Maude]](/sites/default/files/styles/thumbnail_cropped_100/public/2025-03/Barbara%20Fountain%2C%20editor%20of%20New%20Zealand%20Doctor%20Rata%20Aotearoa%2C%20and%20Paul%20Hutchison%2C%20GP%20and%20senior%20medical%20clinician%20at%20T%C4%81maki%20Health%20CR%20Simon%20Maude.jpg?itok=-HbQ1EYA)
![Lori Peters, NP and advanced health improvement practitioner at Mahitahi Hauora, and Jasper Nacilla, NP at The Terrace Medical Centre in Wellington [Image: Simon Maude]](/sites/default/files/styles/thumbnail_cropped_100/public/2025-03/2.%20Lori%20Peters%2C%20NP%20and%20advanced%20HIP%20at%20Mahitahi%20Hauora%2C%20and%20Jasper%20Nacilla%2C%20NP%20at%20The%20Terrace%20Medical%20Centre%20in%20Wellington%20CR%20Simon%20Maude.jpg?itok=sUfbsSF1)
![Ministry of Social Development health and disability coordinator Liz Williams, regional health advisors Mary Mojel and Larah Takarangi, and health and disability coordinators Rebecca Staunton and Myint Than Htut [Image: Simon Maude]](/sites/default/files/styles/thumbnail_cropped_100/public/2025-03/3.%20Ministry%20of%20Social%20Development%27s%20Liz%20Williams%2C%20Mary%20Mojel%2C%20Larah%20Takarangi%2C%20Rebecca%20Staunton%20and%20Myint%20Than%20Htut%20CR%20Simon%20Maude.jpg?itok=9ceOujzC)
![Locum GP Helen Fisher, with Te Kuiti Medical Centre NP Bridget Woodney [Image: Simon Maude]](/sites/default/files/styles/thumbnail_cropped_100/public/2025-03/4.%20Locum%20GP%20Helen%20Fisher%2C%20with%20Te%20Kuiti%20Medical%20Centre%20NP%20Bridget%20Woodney%20CR%20Simon%20Maude.jpg?itok=TJeODetm)
![Ruby Faulkner, GPEP2, with David Small, GPEP3 from The Doctors Greenmeadows in Napier [Image: Simon Maude]](/sites/default/files/styles/thumbnail_cropped_100/public/2025-03/5.%20Ruby%20Faulkner%2C%20GPEP2%2C%20with%20David%20Small%2C%20GPEP3%20from%20The%20Doctors%20Greenmeadows%20in%20Napier%20CR%20Simon%20Maude.jpg?itok=B0u4wsIs)
![Rochelle Langton and Libby Thomas, marketing advisors at the Medical Protection Society [Image: Simon Maude]](/sites/default/files/styles/thumbnail_cropped_100/public/2025-03/6.%20Rochelle%20Langton%20and%20Libby%20Thomas%2C%20marketing%20advisors%20at%20the%20Medical%20Protection%20Society%20CR%20Simon%20Maude.jpg?itok=r52_Cf74)
![Specialist GP Lucy Gibberd, medical advisor at MPS, and Zara Bolam, urgent-care specialist at The Nest Health Centre in Inglewood [Image: Simon Maude]](/sites/default/files/styles/thumbnail_cropped_100/public/2025-03/7.%20Specialist%20GP%20Lucy%20Gibberd%2C%20medical%20advisor%20at%20MPS%2C%20and%20Zara%20Bolam%2C%20urgent-care%20specialist%20at%20The%20Nest%20Health%20Centre%20in%20Inglewood%20CR%20Simon%20Maude.jpg?itok=z8eVoBU3)
![Olivia Blackmore and Trudee Sharp, NPs at Gore Health Centre, and Gaylene Hastie, NP at Queenstown Medical Centre [Image: Simon Maude]](/sites/default/files/styles/thumbnail_cropped_100/public/2025-03/8.%20Olivia%20Blackmore%20and%20Trudee%20Sharp%2C%20NPs%20at%20Gore%20Health%20Centre%2C%20and%20Gaylene%20Hastie%2C%20NP%20at%20Queenstown%20Medical%20Centre%20CR%20Simon%20Maude.jpg?itok=Z6u9d0XH)
![Mary Toloa, specialist GP at Porirua and Union Community Health Service in Wellington, Mara Coler, clinical pharmacist at Tū Ora Compass Health, and Bhavna Mistry, specialist GP at Porirua and Union Community Health Service [Image: Simon Maude]](/sites/default/files/styles/thumbnail_cropped_100/public/2025-03/9.%20Mary%20Toloa%2C%20Porirua%20and%20Union%20Community%20Health%20Service%20in%20Wellington%2C%20Mara%20Coler%2C%20T%C5%AB%20Ora%20Compass%20Health%2C%20and%20Bhavna%20Mistry%2C%20PUCHS%20CR%20Simon%20Maude.jpg?itok=kpChr0cc)